
Data Quality Report
When a Dataset is uploaded in Projects & Datasets, the system creates a Data Quality Report. This summary of the uploaded data is viewable in the Local Data Catalogue.
- Log in to the RDA
- Click Local Data Catalogue
- Click a Project from the list
- Click
The is displayed as a PDF. Your browser should download the file automatically. You may need to install a PDF reader in order to view the Data Quality Report.
This page is made up of the following sections:
The first section of the Data Quality Report shows a list of all tables analysed as part of the report, as shown below:
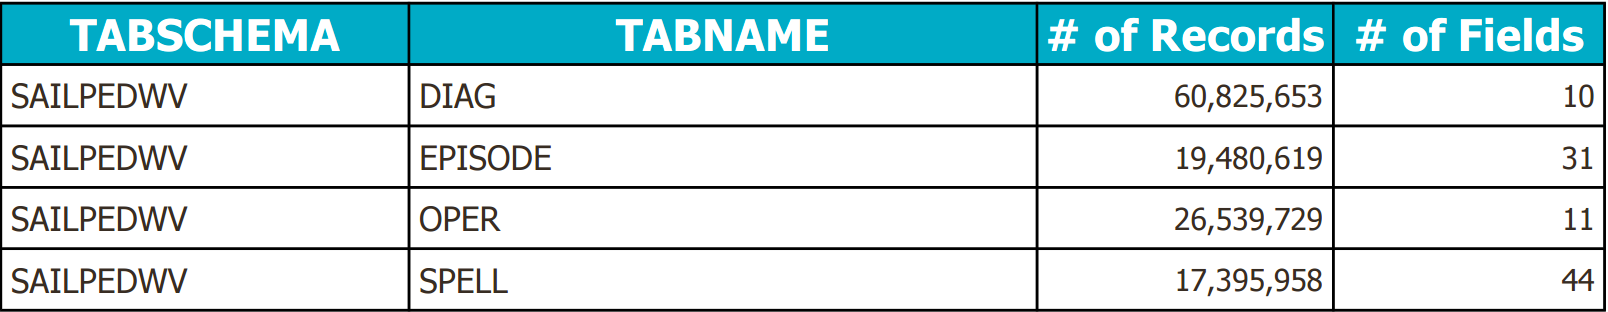
Summary of all tables analysed in the Data Quality Report
- TABSCHEMA – the schema controlling the table
- TABNAME – the table name
- # of Records – the number of records (rows) in the table
- # of Fields – the number of fields (columns) in the table
The results of the analysis of each table are displayed in accordance with the following keys:
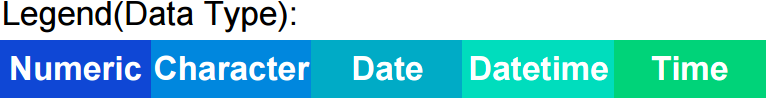
Data Type key
- Numeric – contains numeric data
- Character – contains text data
- Date – contains a date stamp
- Datetime – contains a date and time stamp
- Time – contains a time stamp
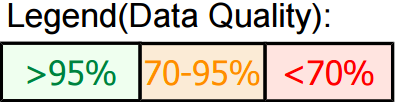
Data Quality key
- >95% – data quality is good
- 70–95% – data quality is moderate
- <70% – data quality is poor
A sample table is shown below:
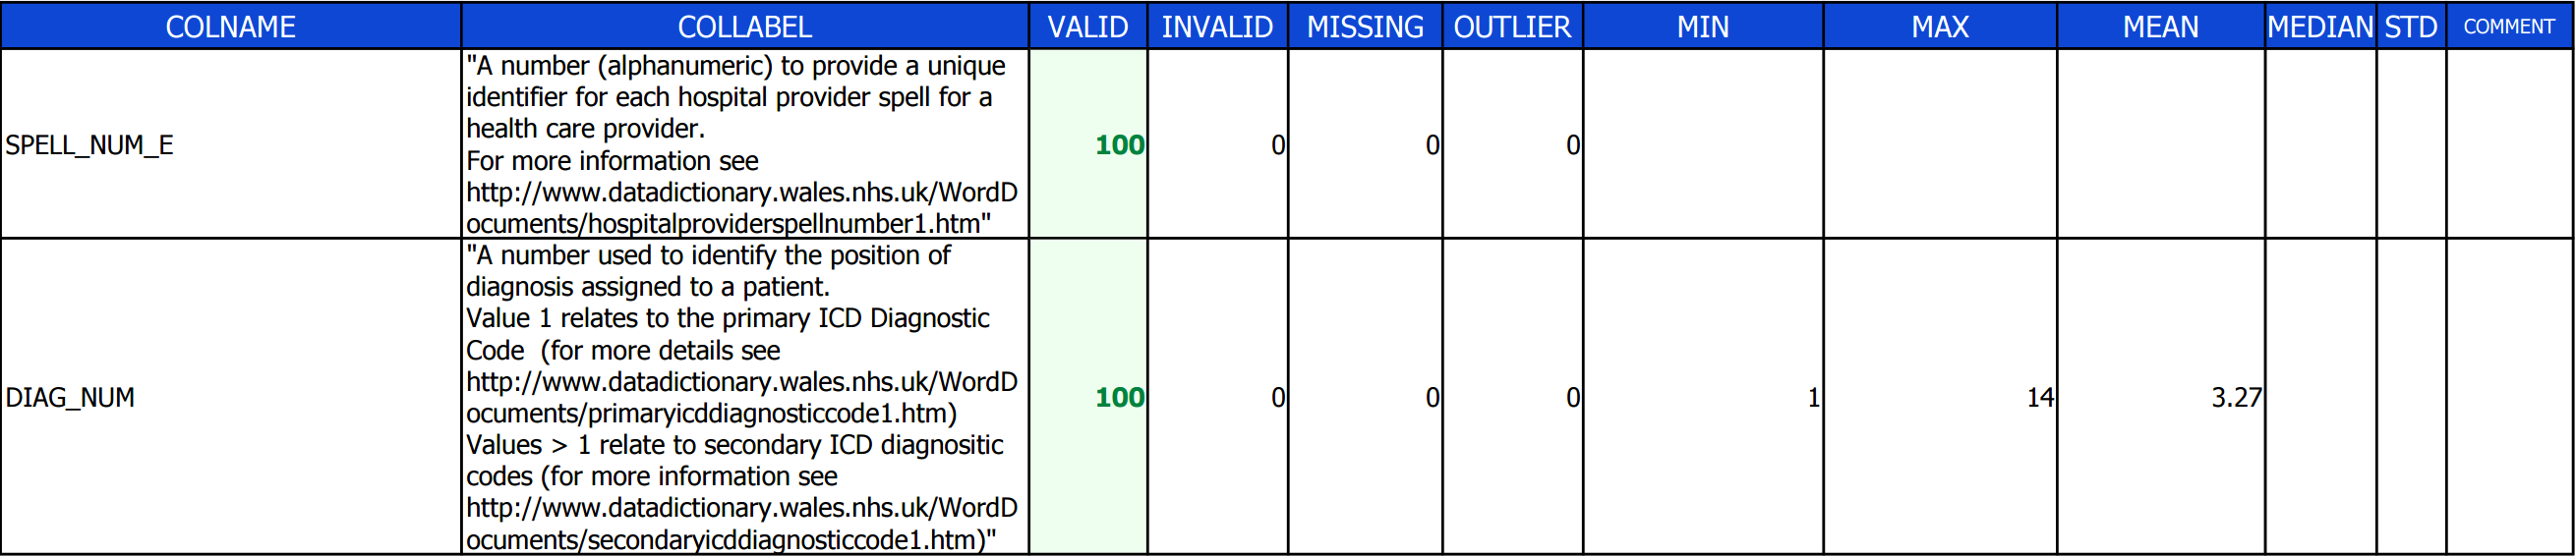
Sample table in the Data Quality Report
This section of the Data Quality Report summarises the analysis of all tables, as shown below:
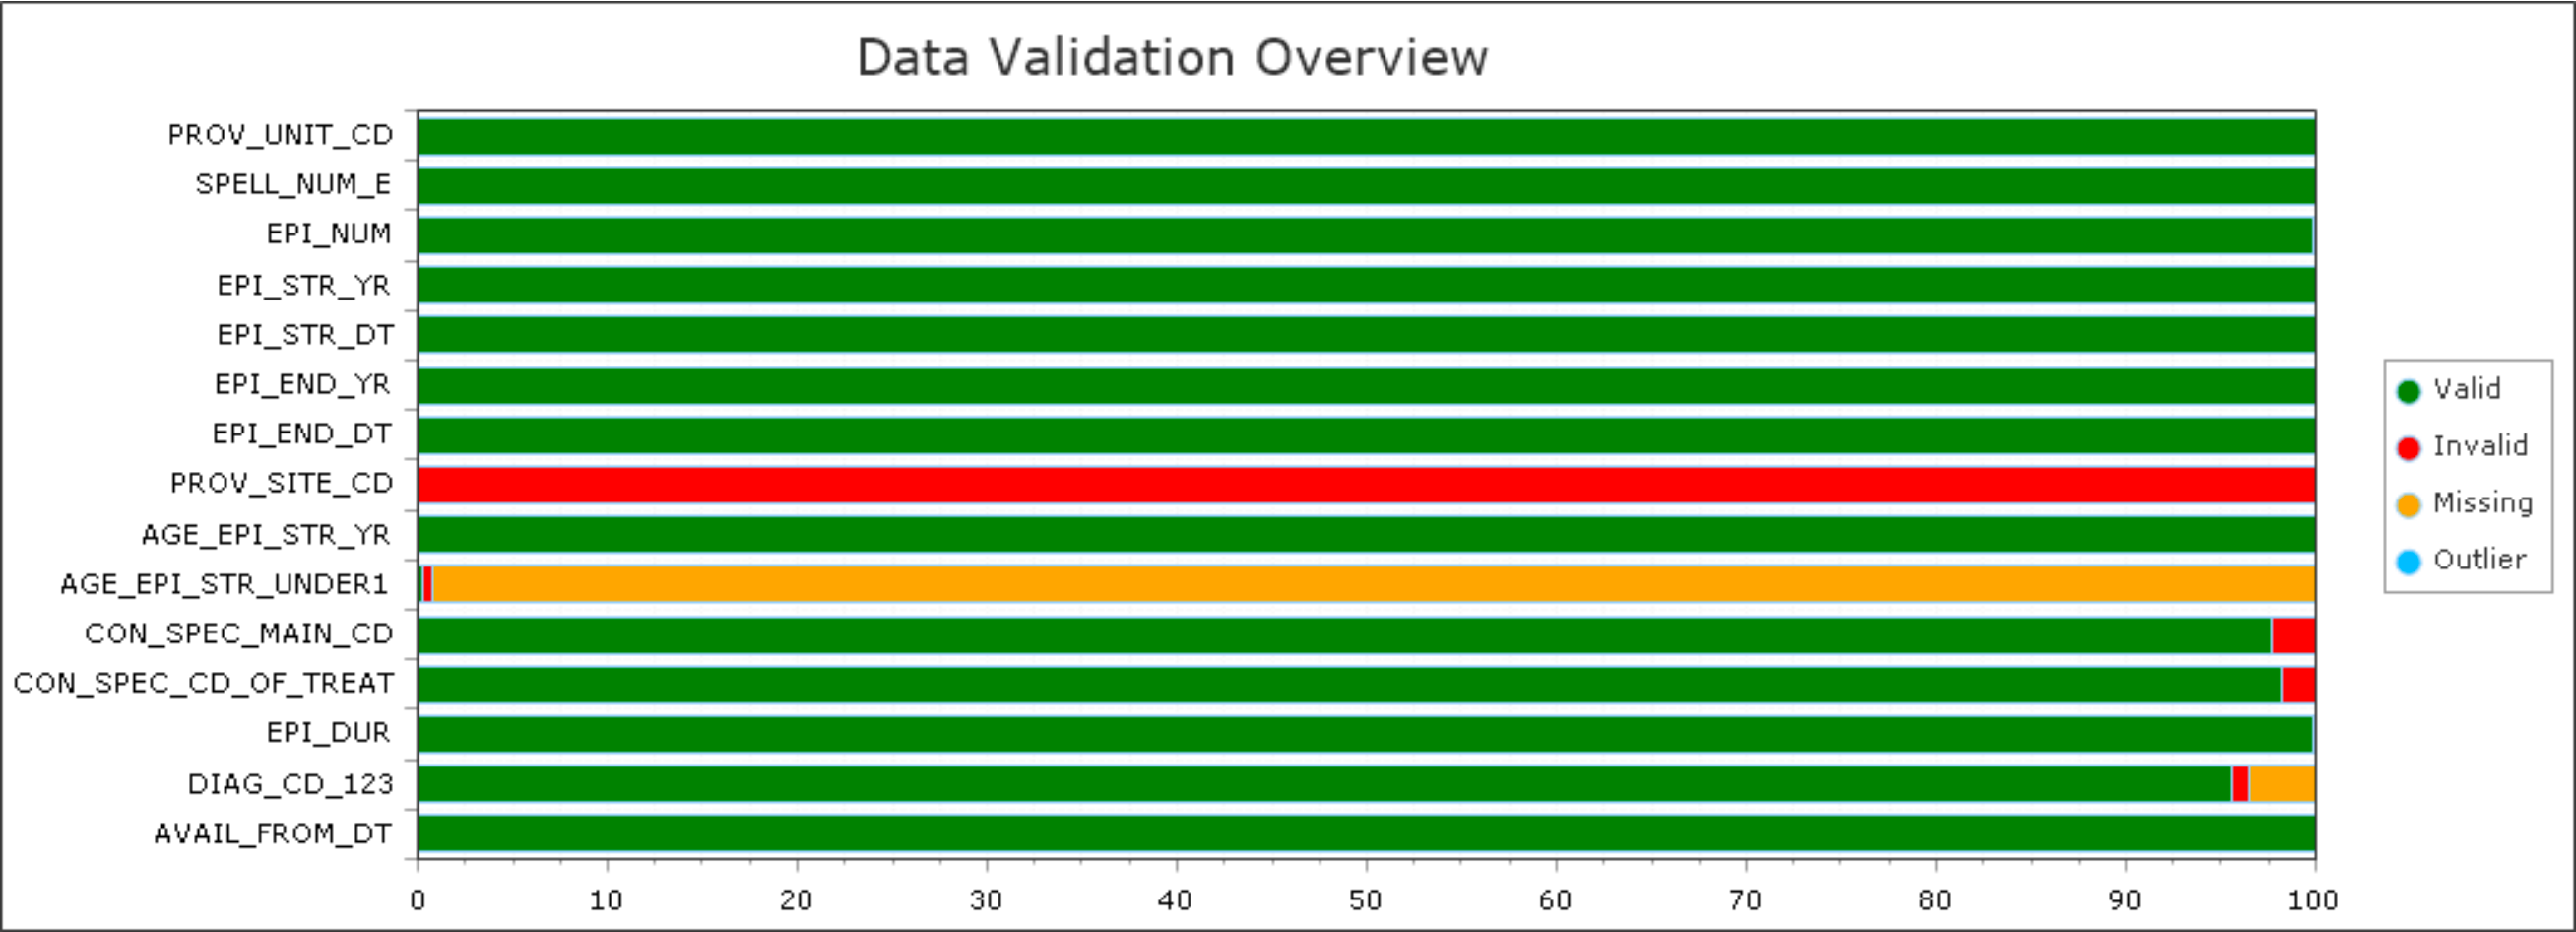
Summary analysis of all tables in the Data Quality Report
This key is used to categorise the data.
- Valid – data is present and valid
- Invalid – data is present but invalid
- Missing – data is missing
- Outlier – data is not within normal range of expected content
An example of the Entity Relationship Diagram included at the end of the Data Quality Report is shown below:
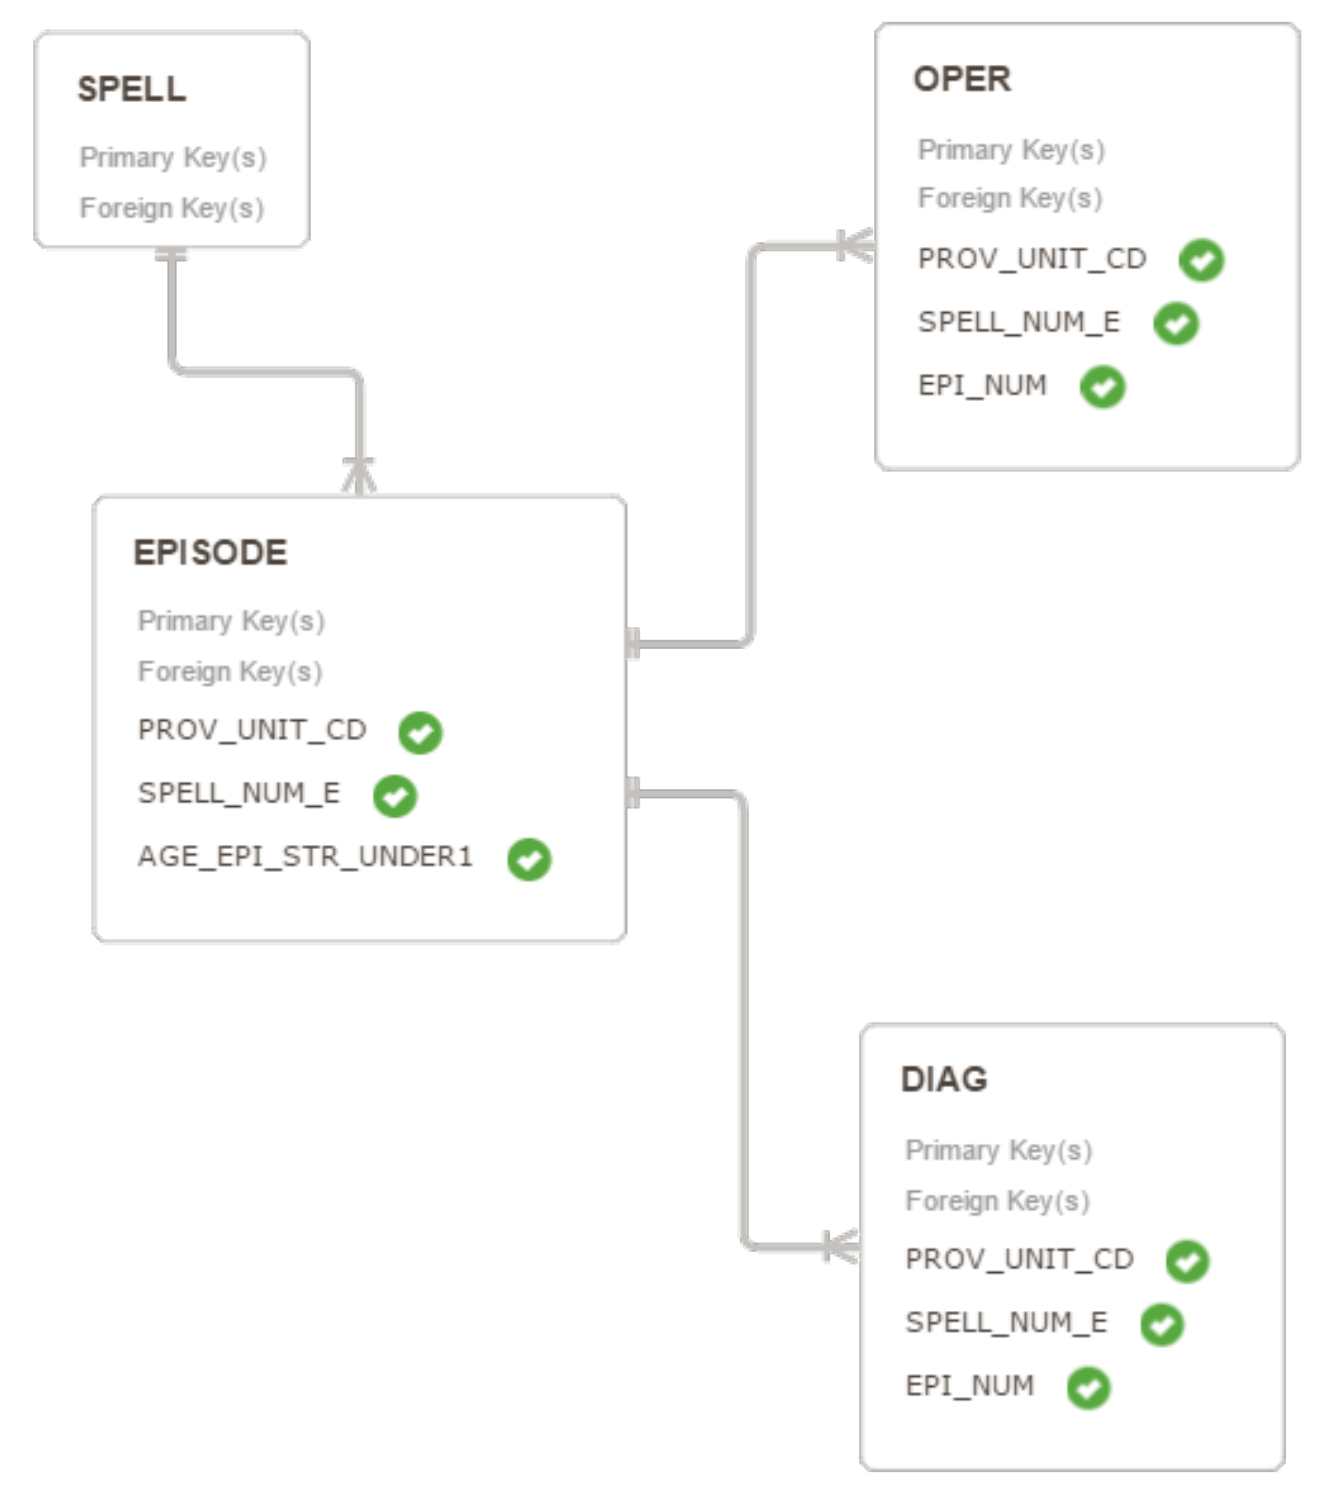
Sample Entity Relationship Diagram
For more information, see Entity Relationship Diagram.